Introducing velo-workspace: Velociraptor Artifacts Without the VQL Tax

I love Velociraptor. Out of the box, the artifact coverage is excellent – forensic collection, event monitoring, threat hunting – it handles the vast majority of DFIR use cases without writing a single line of VQL. But at every shop I’ve worked in, there were always a handful of custom edge cases that the built-in artifacts didn’t quite cover. A specific detection for your environment, an automation that fits your workflow, a collection artifact tailored to your stack. You only need a few custom artifacts, but you need them to be right.
That’s where the friction starts. You have an idea – maybe a new detection, maybe an automation task – and then you spend the next hour fighting VQL syntax, digging through documentation, and debugging column names. The idea was simple. The implementation tax was not.
velo-workspace is a Claude Code workspace that eliminates that tax. You describe what you want to collect or automate in plain English, and it builds the artifact for you – complete with VQL, parameters, documentation, and the correct file structure.
Closing the Iteration Loop
The other pain point with custom artifact development is the feedback loop. The typical workflow looks something like: edit the YAML in a text editor, copy it into the Velociraptor GUI, run it, hit an error, go back to the editor, fix it, copy it back in, repeat. Every iteration involves context-switching between tools and manual steps that slow you down.
velo-workspace closes that loop. It manages a local Velociraptor server (or connects to a remote one) so that the full cycle – edit, deploy, test, troubleshoot – happens inside the same workspace. Run /push to deploy your artifact to the server. Run /test to execute it and see results. If something breaks, you’re already in the right place to fix it and try again. No copy-pasting, no tab-switching, no manual uploads.
Walkthrough
velo-workspace is not a wrapper or a web UI. It’s a Claude Code workspace – a configured environment with slash commands, templates, and domain knowledge baked in. When you open it, you get a purpose-built interface for Velociraptor artifact development:
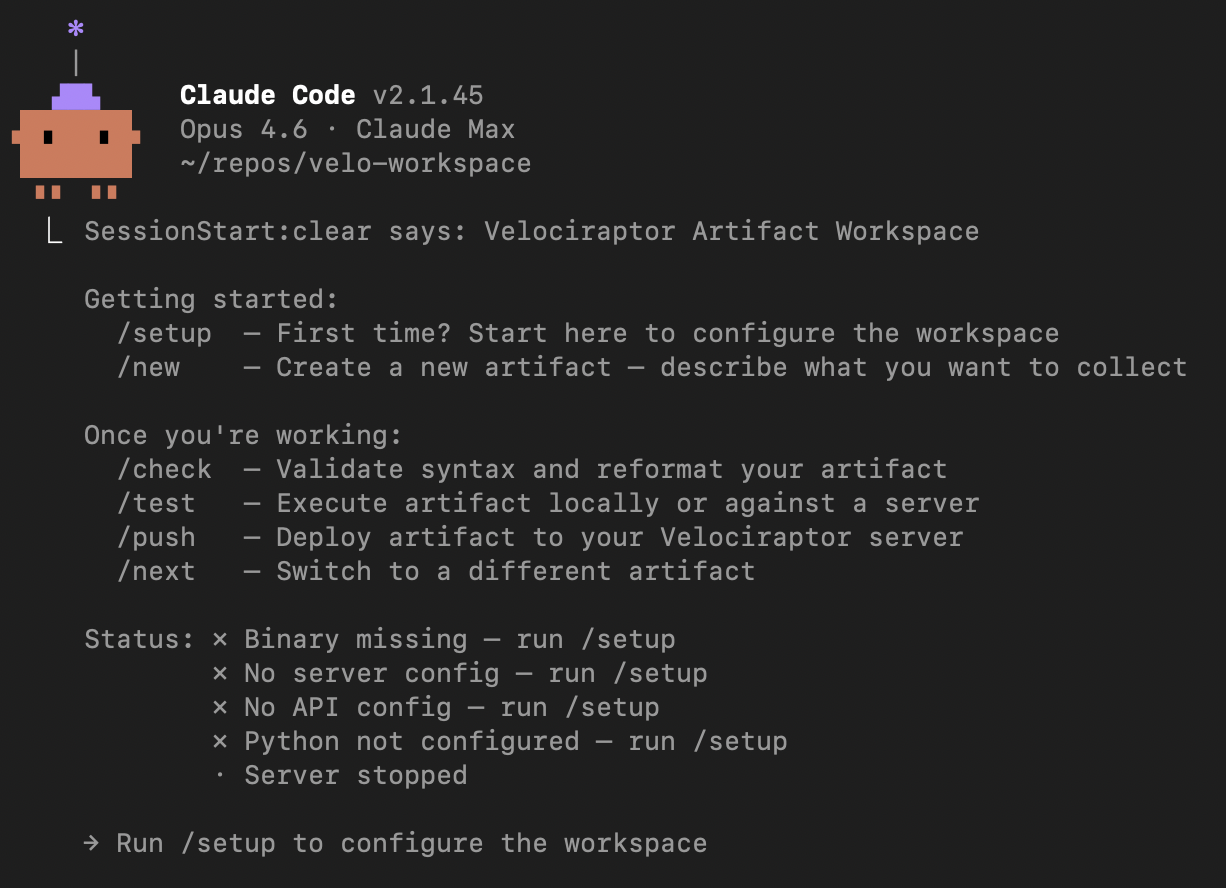
The workspace knows about Velociraptor’s artifact structure, VQL patterns, server vs client artifact distinctions, and common DFIR workflows. It ships with slash commands that map to the artifact development lifecycle: /setup, /new, /check, /test, /push.
Setting Up
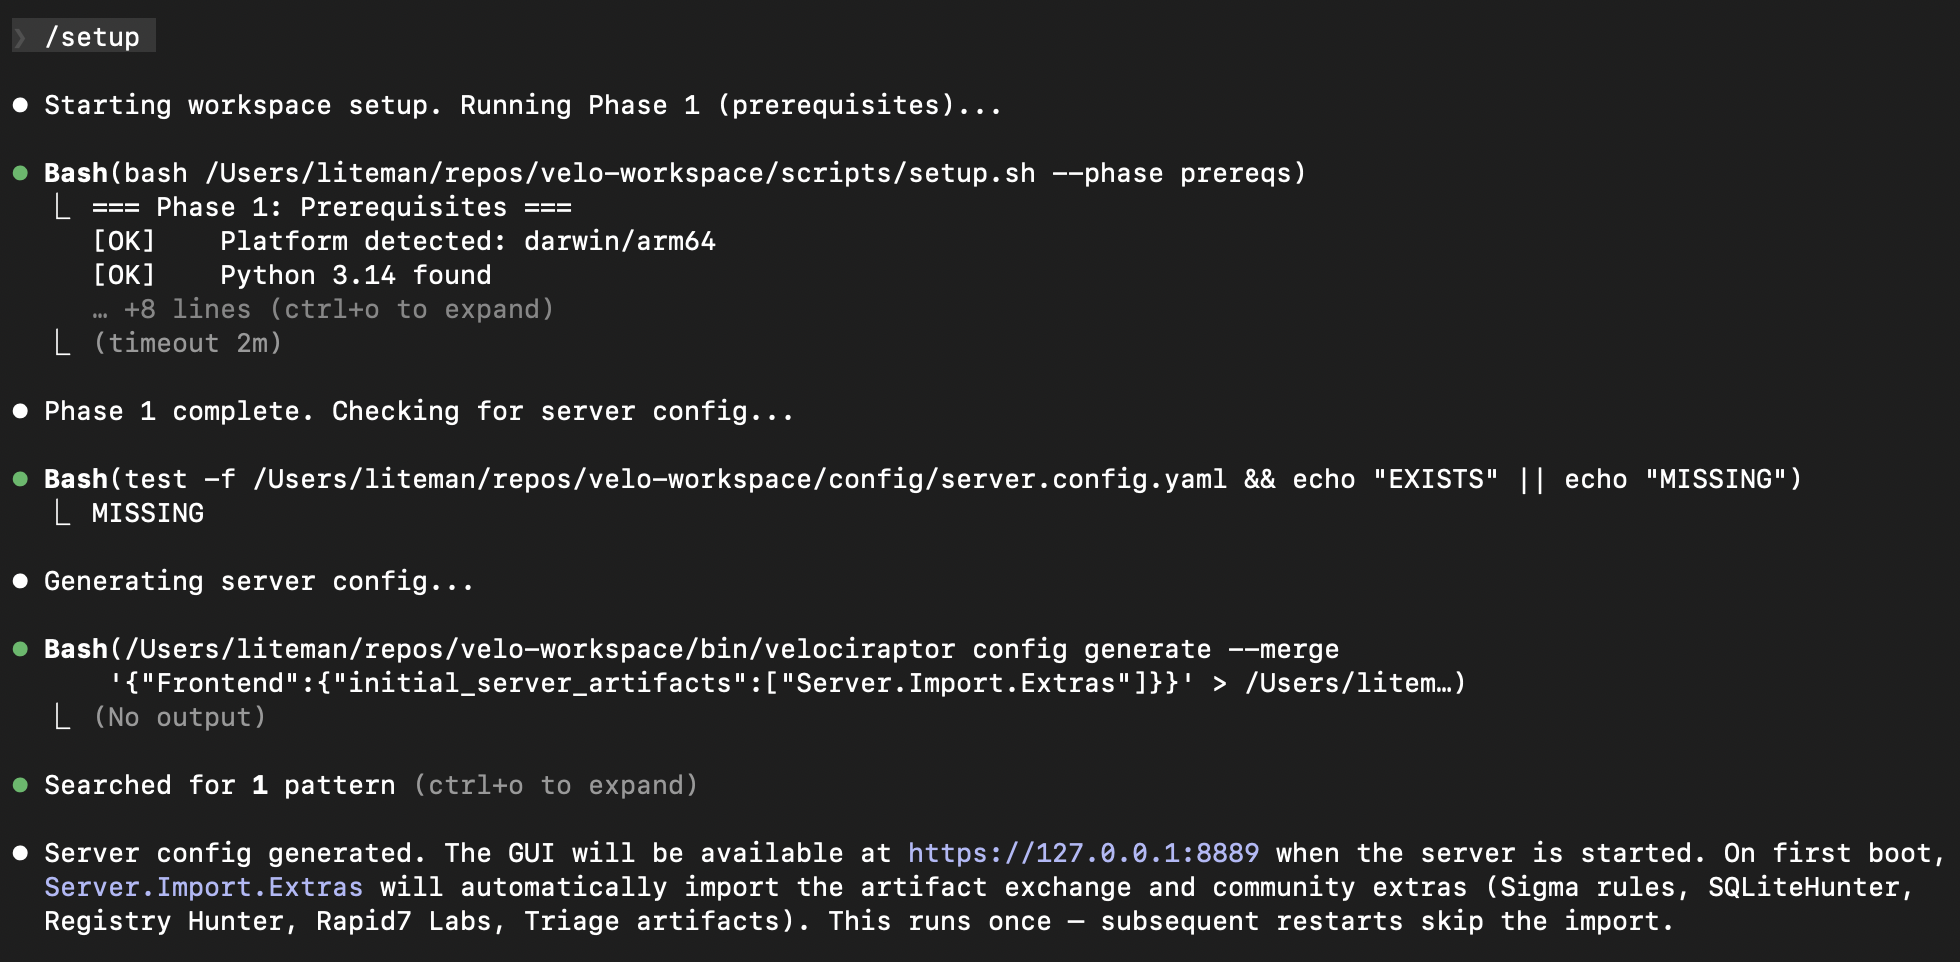
Running /setup kicks off a multi-phase configuration. Phase 1 handles prerequisites – verifying your Python environment, checking for pyvelociraptor, and downloading the latest Velociraptor binary for your platform:

Phase 2 generates a server configuration. If you don’t have one, it creates a config with Server.Import.Extras enabled so the artifact exchange and community content (Sigma rules, SQLiteHunter, Registry Hunter, Rapid7 Labs, Triage artifacts) are automatically imported on first boot:
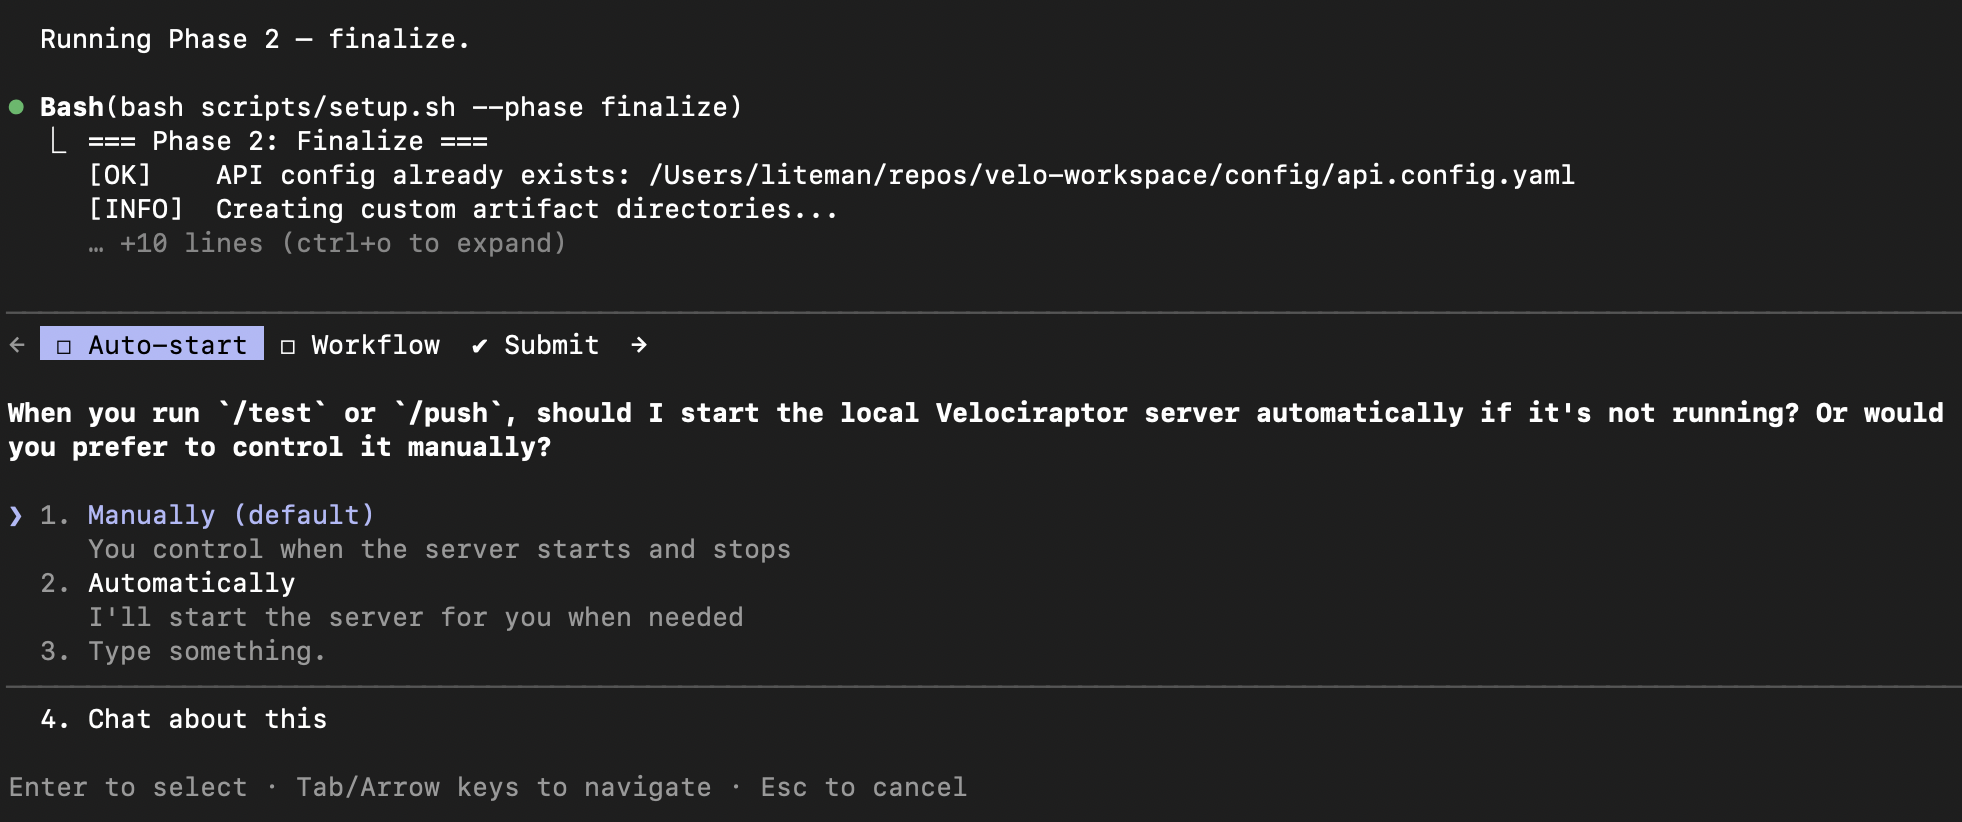
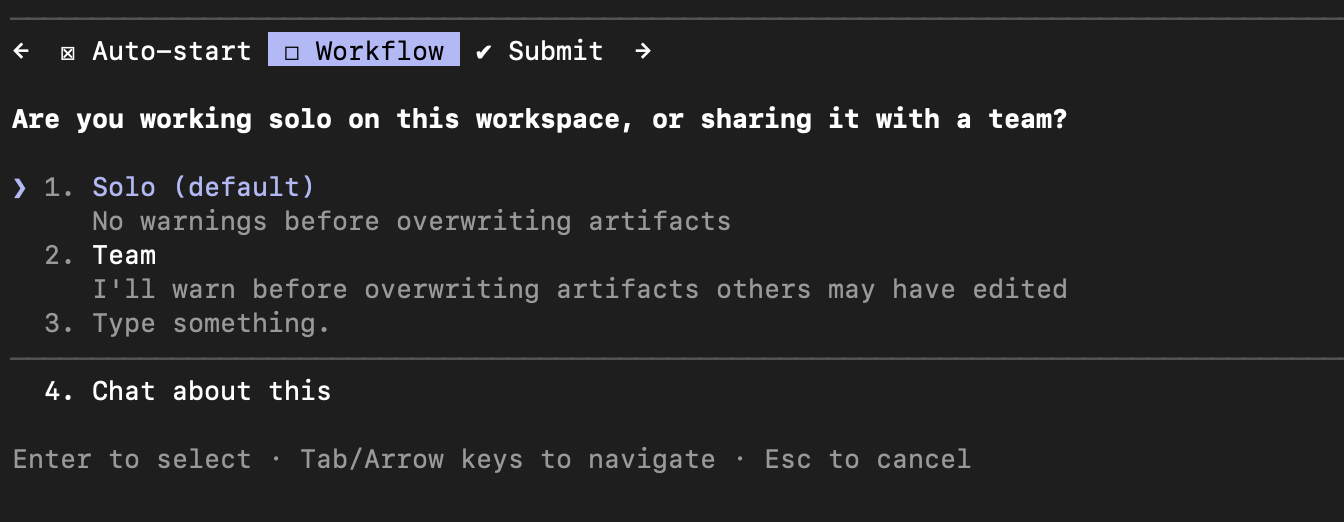
The finalize step asks a couple of preference questions – whether you want the Velociraptor server to auto-start when you run /test or /push, and whether you’re working solo or sharing the workspace with a team:
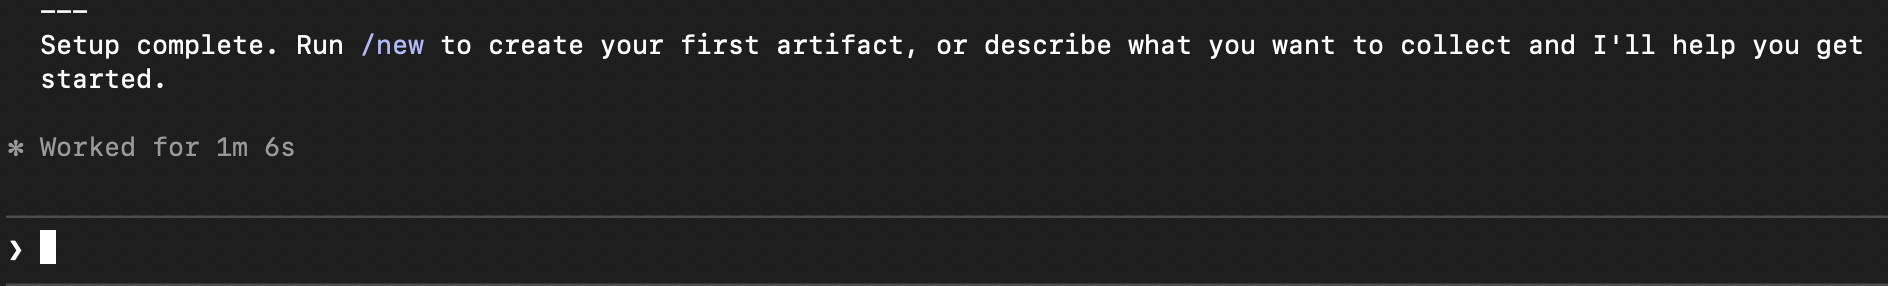
About a minute later, setup is done and you’re ready to build:
Creating an Artifact
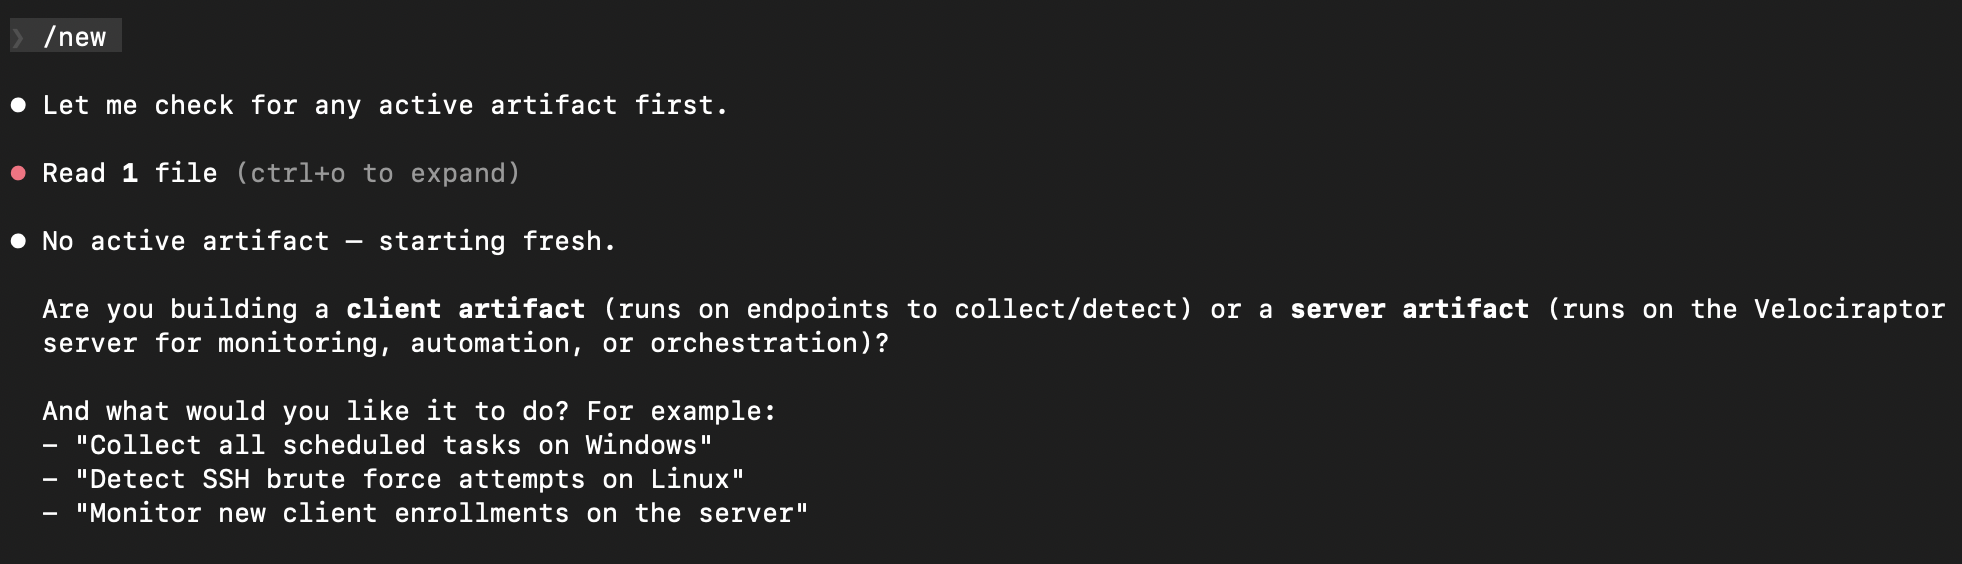
This is where it gets interesting. Running /new starts the artifact creation flow. It first checks if you have an active work-in-progress, then asks whether you’re building a client artifact (runs on endpoints) or a server artifact (runs on the Velociraptor server):
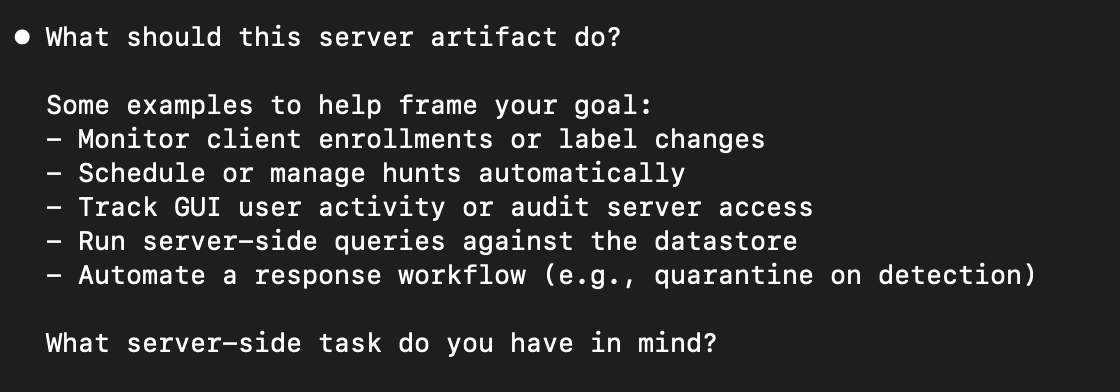
I chose server artifact, and it offered examples of common server-side tasks to help frame the request:
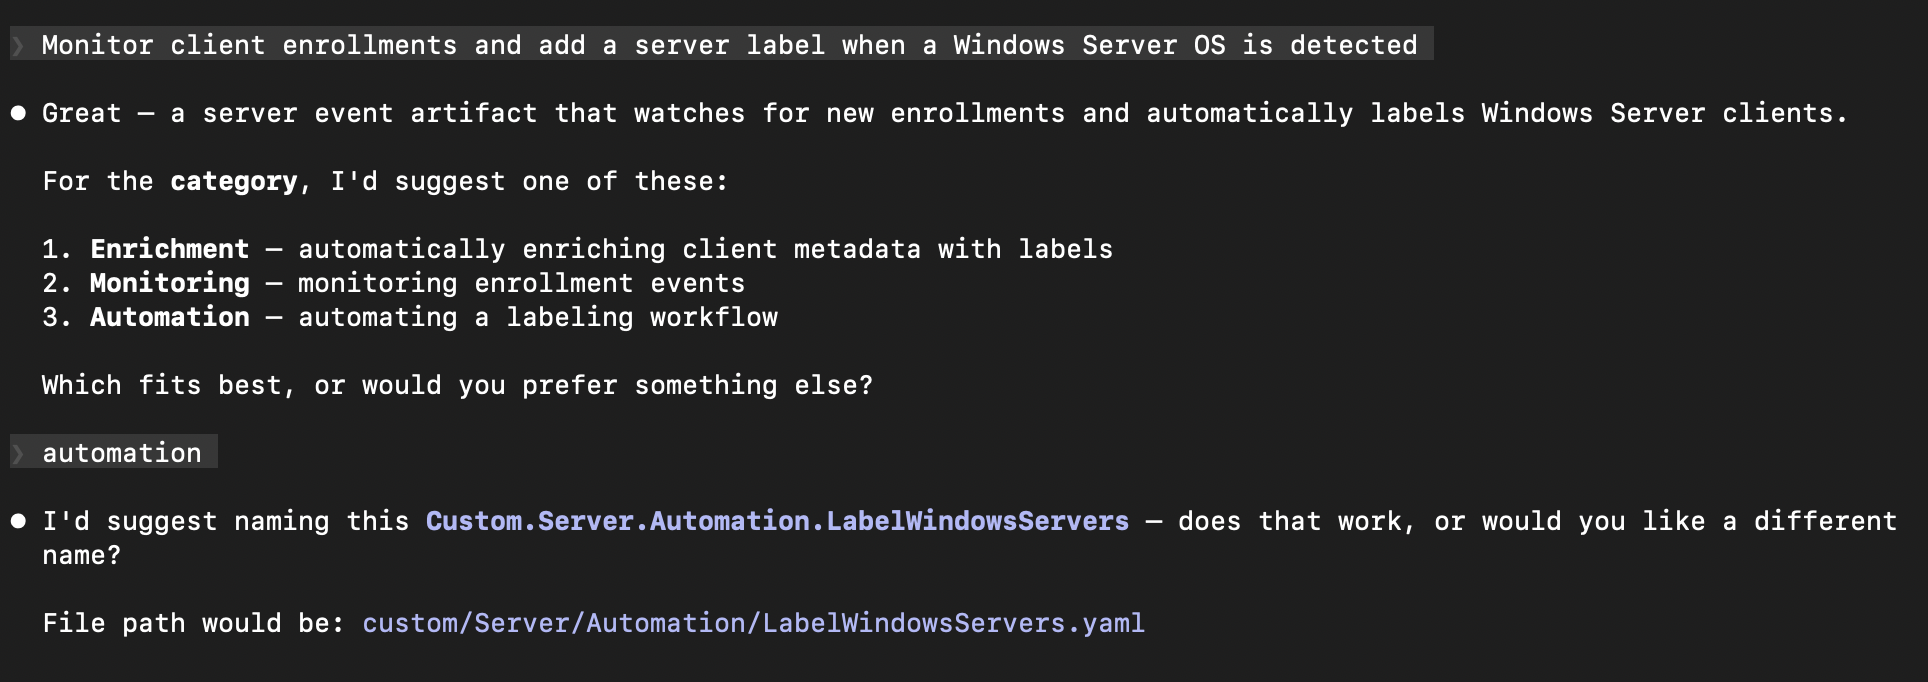
Here’s where natural language takes over. I described what I wanted: “Monitor client enrollments and add a server label when a Windows Server OS is detected.” No VQL, no YAML structure, no artifact naming conventions. Just the goal.
The workspace immediately understood the intent, suggested an appropriate category (Automation), and proposed a name following Velociraptor’s naming convention:
After I confirmed the name, it showed the complete implementation plan – the artifact type, parameters, and the full VQL logic – before writing anything:
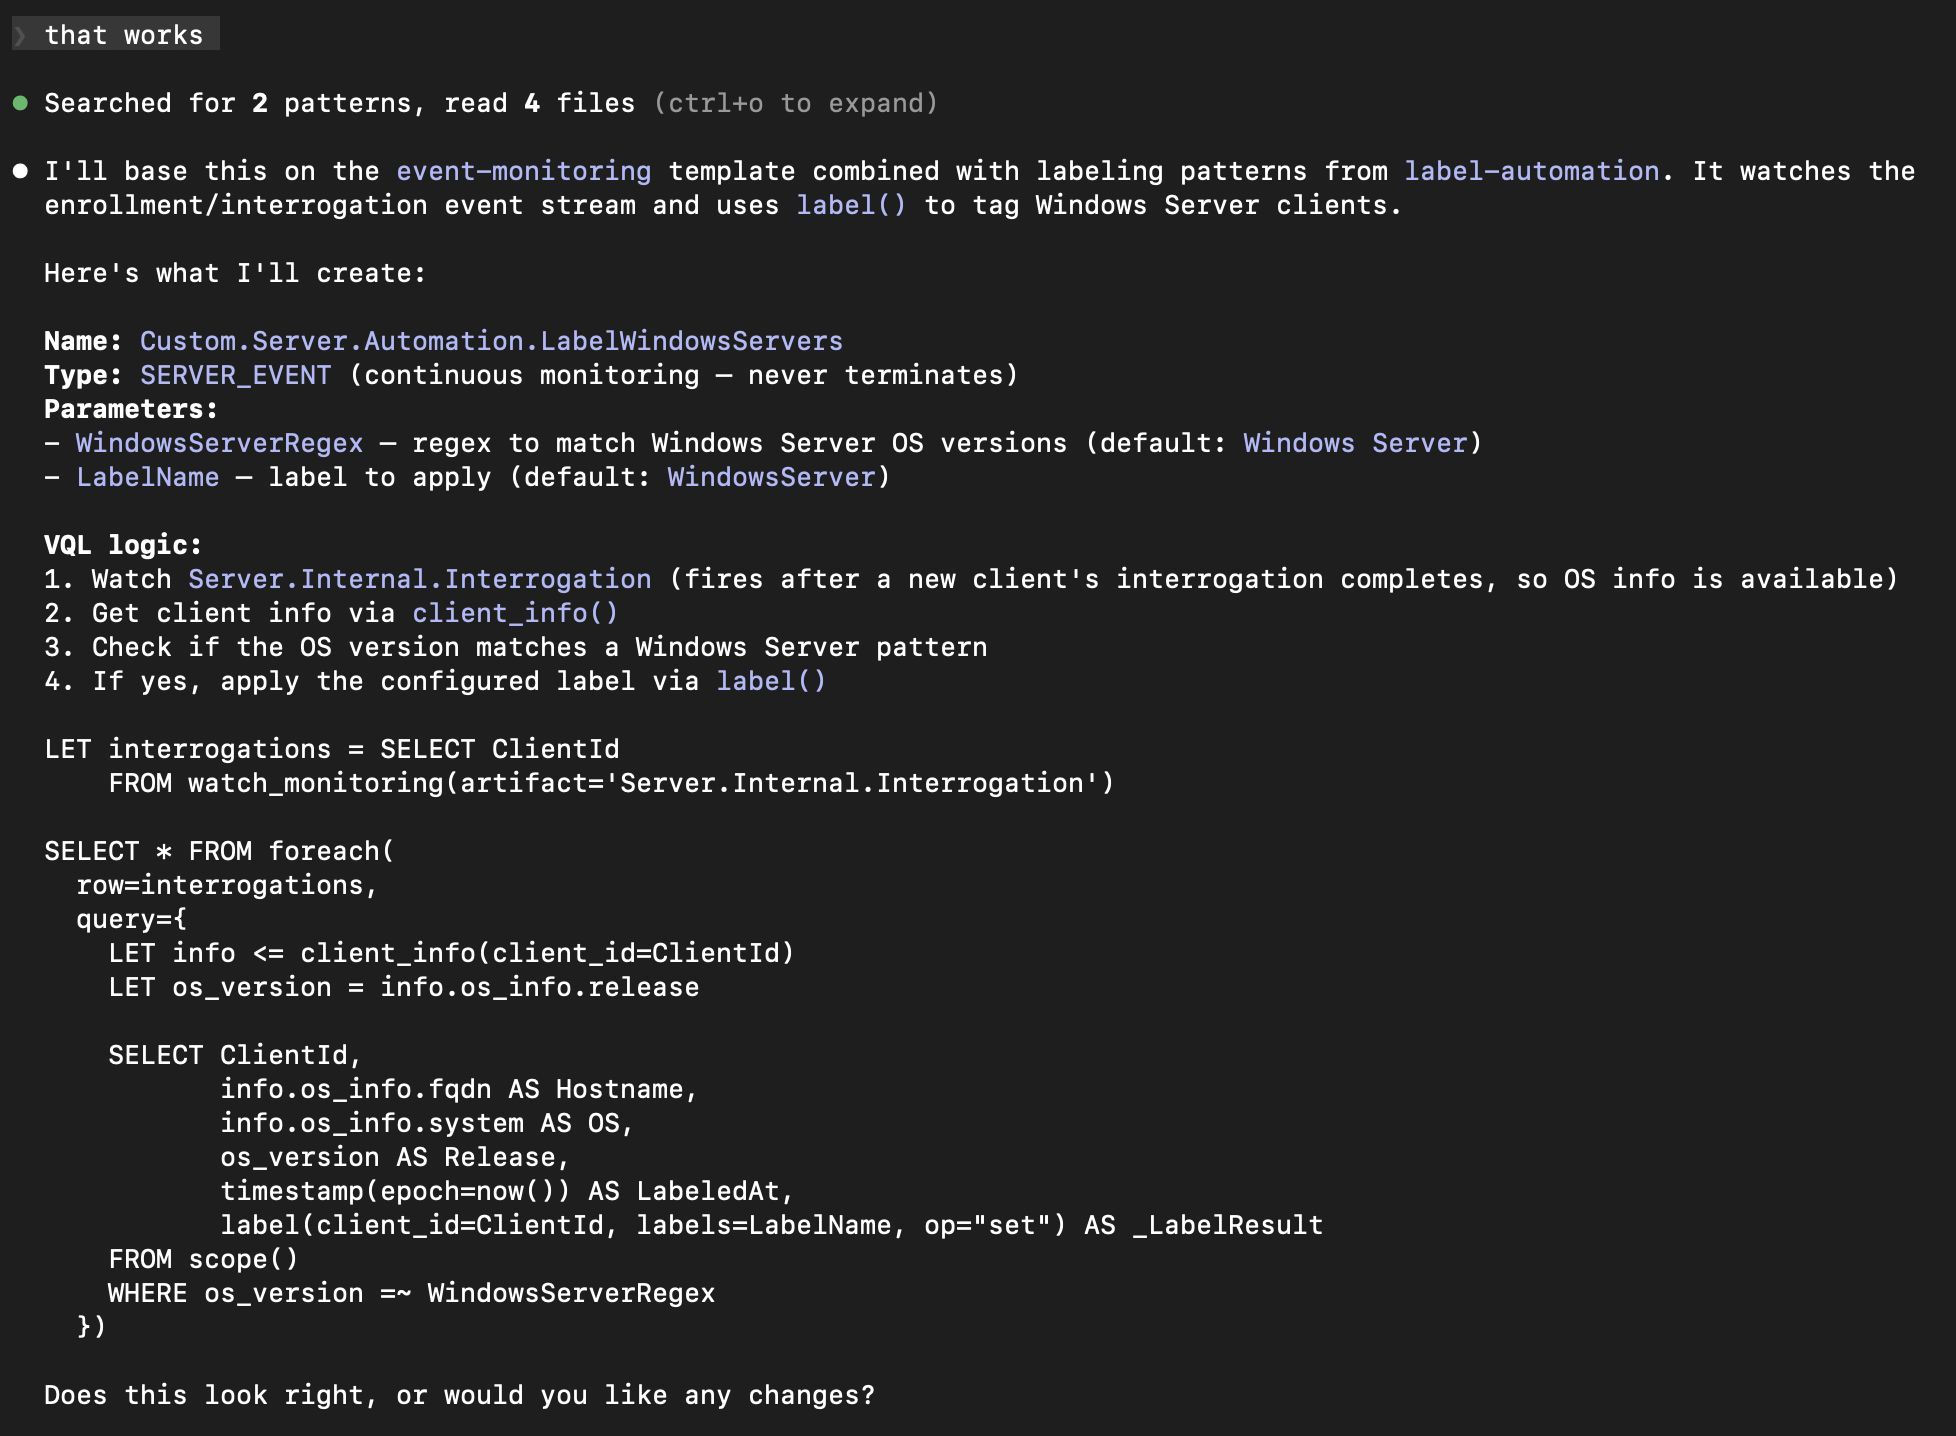
The VQL watches Server.Internal.Interrogation events, pulls client info to check the OS version against a configurable regex, and applies a label via label(). It included sensible defaults (matching “Windows Server” and applying a “WindowsServer” label) and made both configurable as parameters. This is the kind of boilerplate that takes 20 minutes to get right manually – getting the watch_monitoring syntax correct, remembering the right client_info() call, structuring the foreach and query properly.
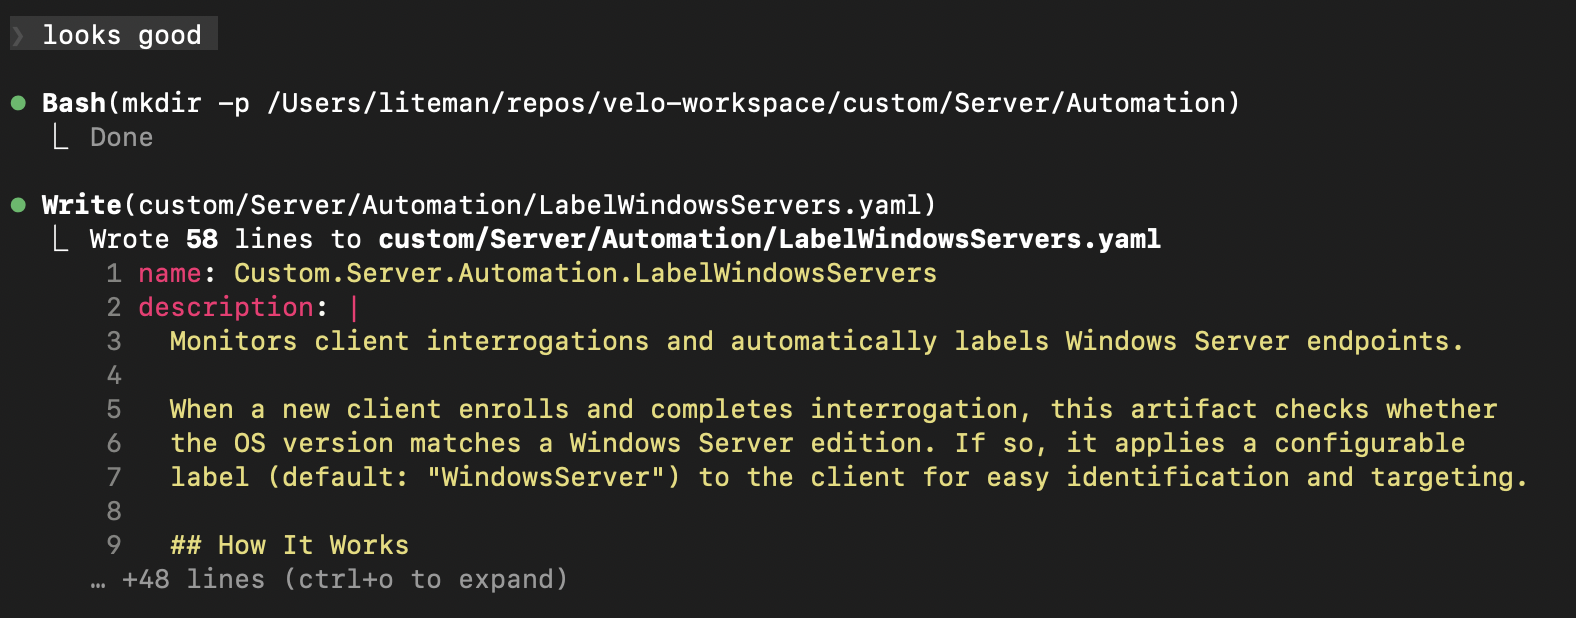
One “looks good” later, the artifact is written:
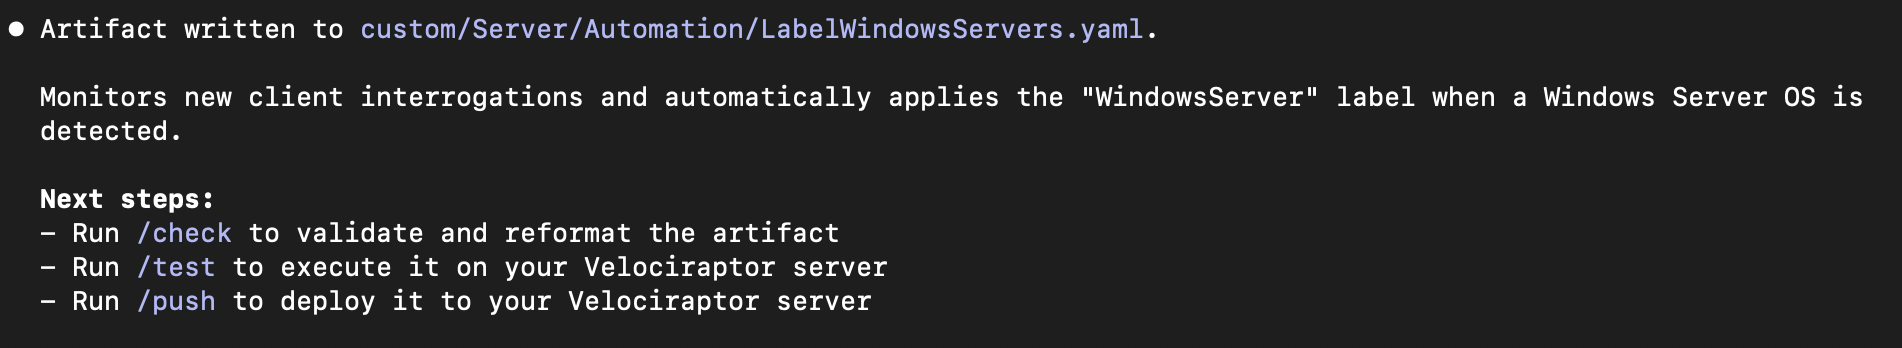
And the workspace tells you exactly what to do next – /check to validate, /test to execute against your server, /push to deploy:
Why This Matters
The artifact I built in this walkthrough took about two minutes from idea to YAML. That same artifact, built manually, means opening the VQL reference, remembering the SERVER_EVENT type syntax, getting the watch_monitoring pattern right, and structuring the parameters correctly. It’s not hard if you’ve done it before, but it’s friction – and friction kills momentum.
More importantly, velo-workspace lowers the barrier for analysts who know what they want to detect or automate but don’t write VQL regularly. The tribal knowledge about artifact structure, naming conventions, and VQL patterns is encoded in the workspace itself. You bring the detection logic; it handles the implementation.
The project is open source at github.com/liteman/velo-workspace and listed on my Projects page. Set it up, run /new, and describe what you want to build.
Curious how this post was made? I wrote about the process in Screenshots to Blog Post — 12 PNGs in, nearly finished draft out.